




Gas Sensor Detection Limit: LOD vs Resolution vs Accuracy
A gas sensor datasheet may list:
- Resolution: 0.1 ppm
- Measurement range: 0–100 ppm
- Accuracy: ±2 ppm
- Detection limit: 0.8 ppm
At first glance, these numbers can appear to describe the same thing.
They do not.
A detector that displays values in 0.1 ppm increments does not automatically have a 0.1 ppm detection limit. A sensor with a very low detection limit is not automatically highly accurate. And a highly sensitive sensing element can still perform poorly at low concentrations if its baseline is noisy or unstable.
The most useful distinction is:
LOD asks whether the gas can be reliably distinguished from background. Resolution asks how small a change the measurement system can distinguish or report. Accuracy asks how close the reported value is to an accepted reference value.
For engineers comparing gas sensors, these distinctions are essential.
LOD vs Resolution vs Accuracy: Quick Comparison
| Parameter | Main Question | Typical Example |
|---|---|---|
| Limit of Detection (LOD) | What is the lowest concentration that can be reliably distinguished from background? | 0.8 ppm |
| Resolution | What is the smallest change the measurement system can meaningfully distinguish or indicate? | 0.1 ppm |
| Accuracy | How close is the measurement to the accepted reference value? | ±2 ppm or ±3% of reading |
| Sensitivity | How much does sensor output change per unit concentration? | 5 nA/ppm |
| Measurement Range | What concentration interval is specified for measurement? | 0–100 ppm |
These values answer different questions.
A sensor could legitimately have:
Range: 0–100 ppm
Resolution: 0.1 ppm
LOD: 0.8 ppm
Accuracy: ±2 ppm
There is no contradiction.
What Is the Limit of Detection (LOD)?
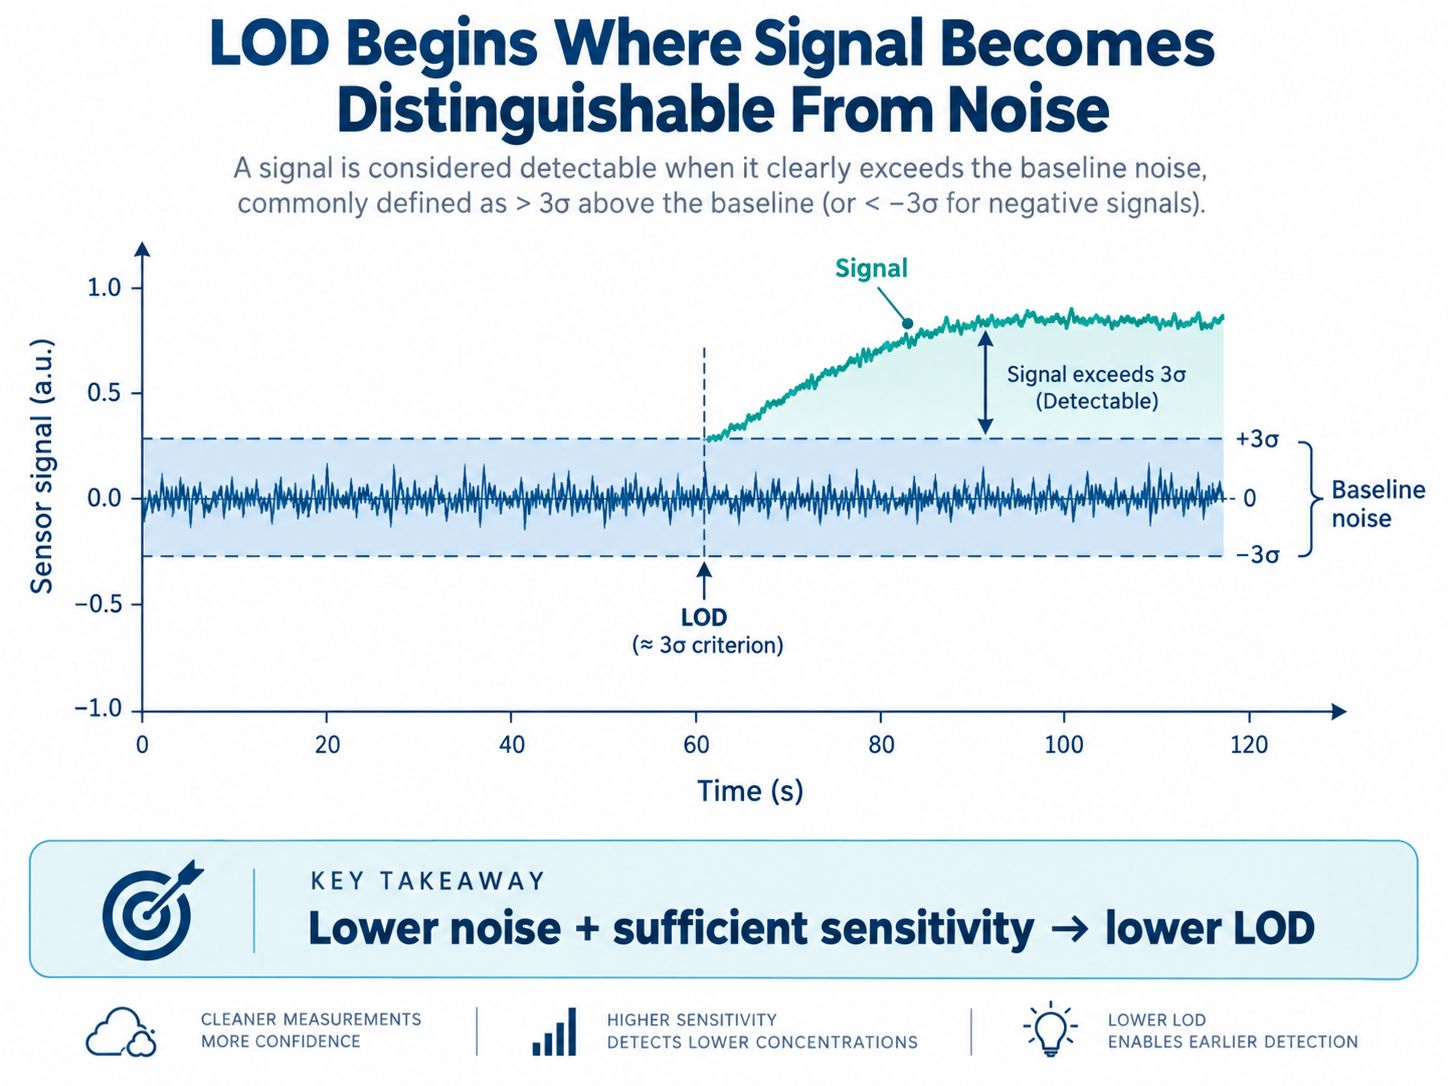
The limit of detection, usually shortened to LOD, describes the lowest signal or concentration that can be distinguished from a suitable blank or baseline with a stated level of confidence.
In practical gas sensing, this means:
How small can the target-gas signal become before it is no longer distinguishable from normal baseline variation?
Imagine a gas sensor operating in zero air.
Even when no target gas is intentionally present, its output may not be perfectly flat.
It may fluctuate because of:
- electronic noise
- electrode noise
- optical noise
- temperature variation
- humidity variation
- baseline instability
- ADC and amplifier noise
A small gas signal must rise sufficiently above that background before it can be considered reliably detectable.
The IUPAC Gold Book defines detection limit in terms of a result that can be distinguished from a suitable blank with a stated probability. That is an important point: LOD is not simply the smallest number printed on the display.
See: IUPAC — Limit of Detection
Why Baseline Noise Matters
Suppose Sensor A has a very stable zero:
0.01
0.00
-0.01
0.02
0.00
while Sensor B fluctuates:
0.8
-0.7
1.1
-0.9
0.6
If both sensors have the same sensitivity, Sensor A can generally distinguish a much smaller target-gas signal from baseline.
That is why a low LOD usually requires both:
enough sensitivity
and:
low, stable noise
A sensor can be extremely sensitive yet still have a disappointing LOD if its noise is large.
How Is LOD Calculated?
There is no single universal calculation that applies to every sensor, test method and regulatory context.
However, for a reasonably linear calibration relationship, a common engineering approximation is:
LOD ≈ k × σ / Swhere:
σ= standard deviation or another measure of baseline noiseS= sensitivity or calibration slopek= a statistical factor selected for the chosen detection criterion
A 3σ-type criterion is commonly encountered in sensor literature:
LOD ≈ 3 × σ / SBut this should be treated as a method-dependent approximation, not a universal law.
IUPAC defines LOD more generally using the blank mean, blank standard deviation and a factor chosen according to the desired confidence level.
Therefore, when comparing two published LOD values, ask:
- How was the blank measured?
- How many measurements were taken?
- Was the calibration linear?
- What statistical criterion was used?
- Was environmental compensation applied?
- Was the result calculated or experimentally verified?
An LOD number without its method is incomplete information.
Sensitivity and Noise Both Determine Low-Level Detection
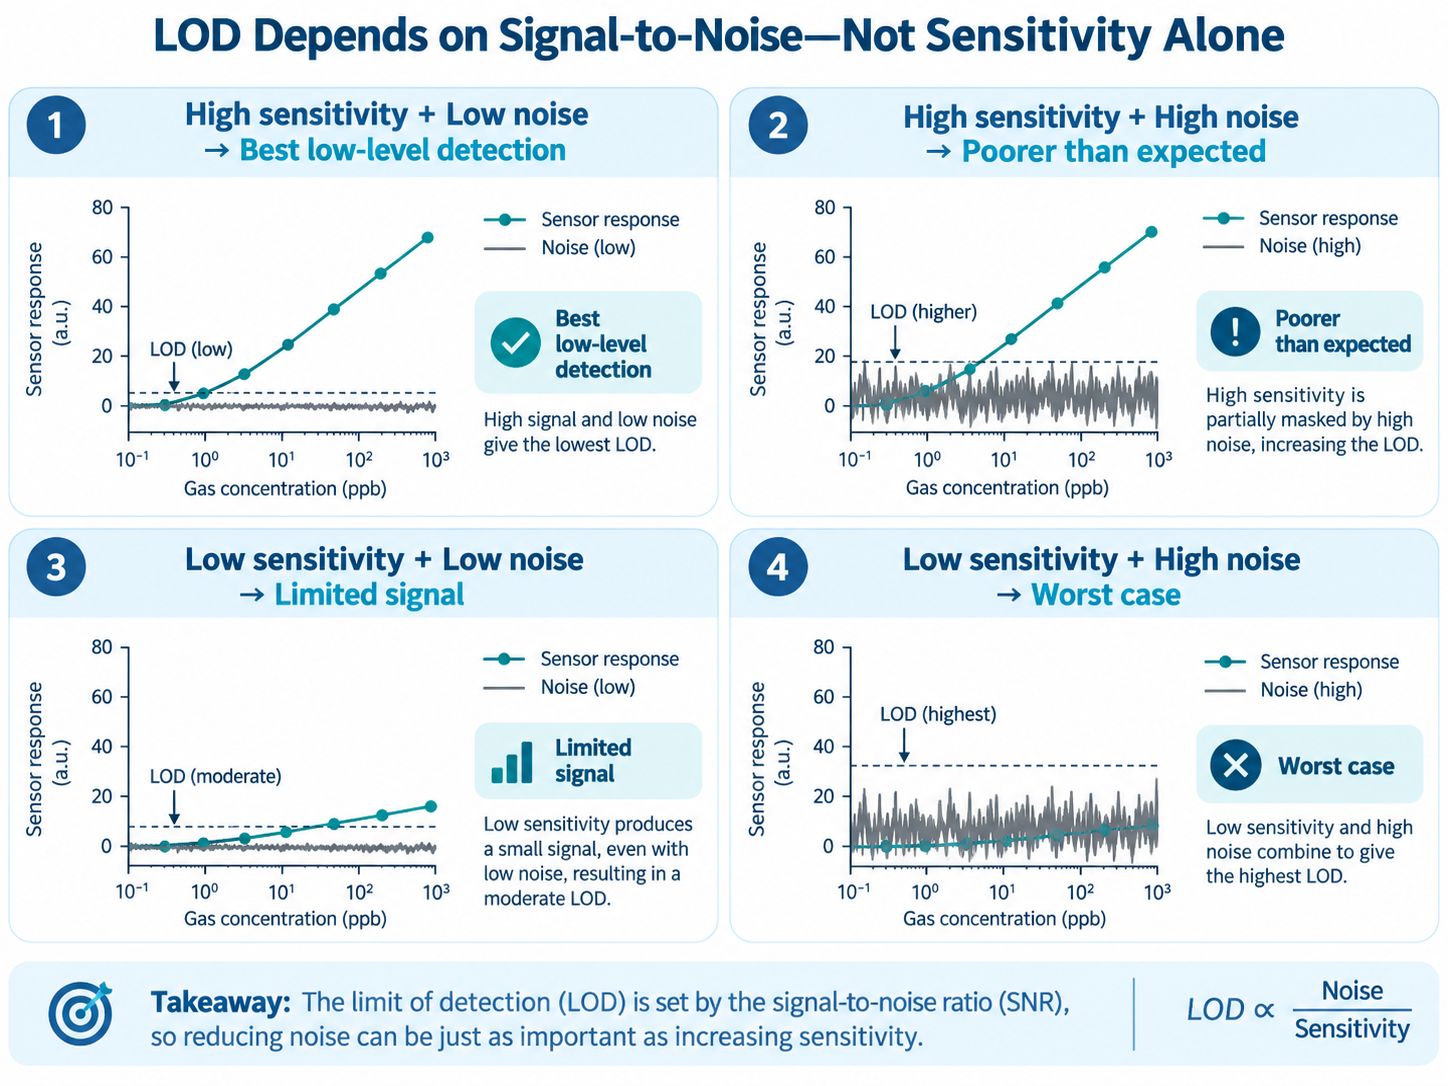
Sensitivity alone does not determine detection limit.
Consider four simplified cases.
High Sensitivity + Low Noise
This is the best situation for low-level detection.
A small concentration change creates a strong signal that clearly exceeds baseline variation.
High Sensitivity + High Noise
The signal is strong, but the baseline fluctuates heavily.
The theoretical advantage of high sensitivity can be partly lost.
Low Sensitivity + Low Noise
The baseline is clean, but small gas concentrations create only a weak response.
LOD may still be limited.
Low Sensitivity + High Noise
This is the most difficult combination for trace detection.
The signal is small and the background is unstable.
The useful engineering principle is:
LOD depends on signal-to-noise performance, not sensitivity alone.
For a deeper explanation of sensitivity itself, see Gas Sensor Sensitivity vs Selectivity: What’s the Difference?.
What Is Gas Sensor Resolution?
Resolution describes the smallest change in the measured quantity that the measurement system can meaningfully distinguish and indicate.
For example, an instrument may specify:
Resolution: 0.1 ppmThat may allow readings such as:
10.0 ppm
10.1 ppm
10.2 ppm
But this does not automatically mean the instrument can reliably detect a change from:
0.0 ppmto:
0.1 ppmin real operating conditions.
NIST defines resolution as the ability of a measurement system to detect and faithfully indicate small changes, and specifically warns that the number of digits displayed does not by itself establish the instrument’s true resolution.
See: NIST — Resolution
Display Resolution vs Measurement Resolution
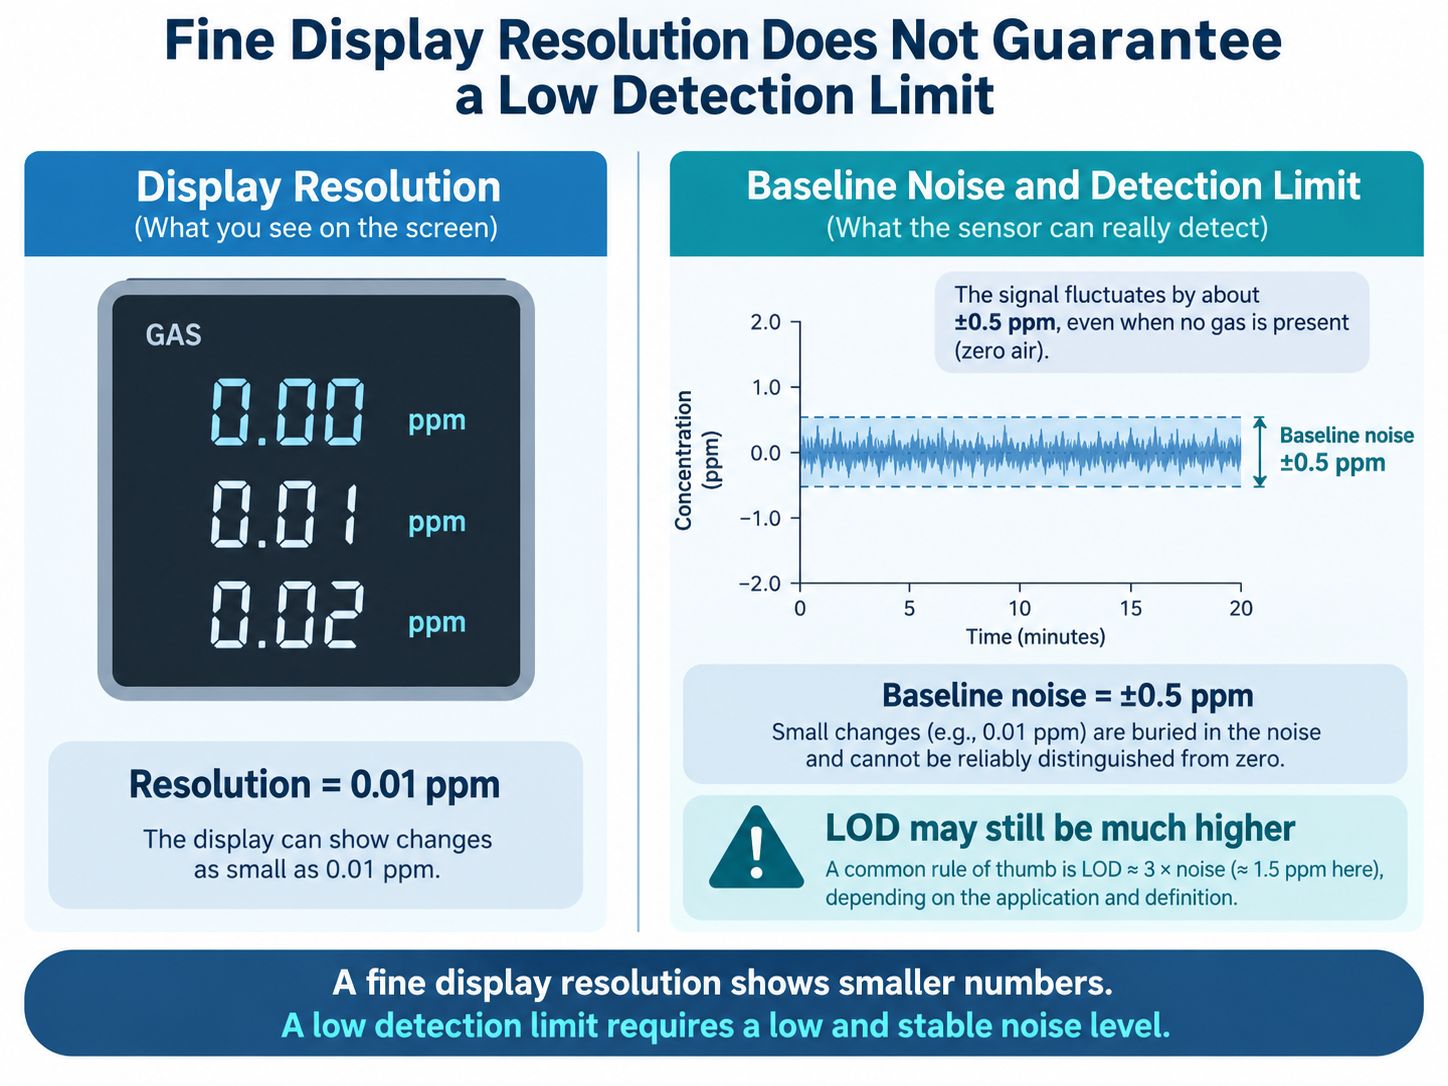
This distinction is extremely important for digital gas detectors.
A display may show:
0.00 ppmand later:
0.01 ppmbecause the firmware supports 0.01 ppm increments.
But suppose the underlying sensing system fluctuates naturally by:
±0.5 ppmThe last decimal places may have little practical significance.
This leads to an important rule:
More decimal places do not automatically mean more measurement information.
A manufacturer may legitimately specify a digital display increment smaller than the practical field detection limit.
The two parameters should not be confused.
Example: 0.01 ppm Resolution Does Not Mean 0.01 ppm LOD
Suppose an instrument displays:
Resolution: 0.01 ppmBut repeated zero readings are:
0.32 ppm
-0.18 ppm
0.41 ppm
-0.27 ppm
0.15 ppm
The display is capable of showing very small numerical steps.
The baseline, however, varies by much more than 0.01 ppm.
A true 0.01 ppm gas change would therefore be buried inside the natural variation.
So:
0.01 ppm resolutiondoes not imply:
0.01 ppm detection limitThis is one of the most common mistakes when comparing low-concentration gas sensors.
What Is Gas Sensor Accuracy?
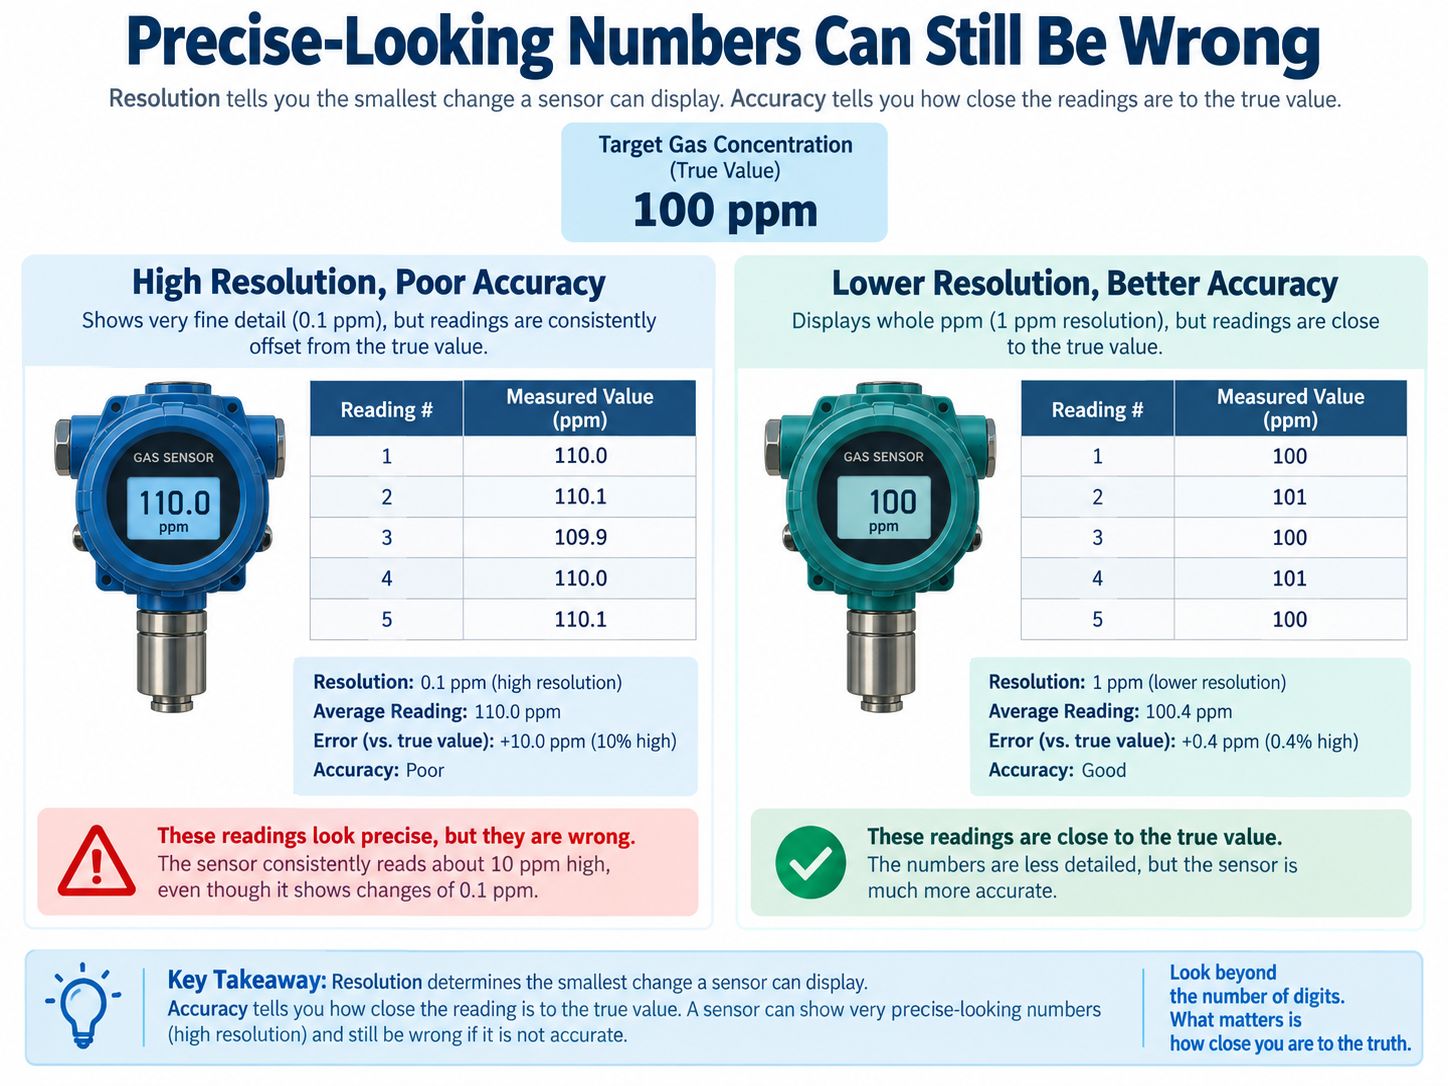
Accuracy describes how closely a measured result agrees with an accepted reference value.
Suppose a certified gas reference is:
100 ppmSensor A
Repeated readings:
110.0
110.1
109.9
110.0 ppm
The readings look extremely precise and stable.
But they are approximately 10 ppm too high.
Sensor B
Repeated readings:
100
101
100
99 ppm
The display is less finely resolved, but the results are much closer to the reference.
This demonstrates another key principle:
Precise-looking numbers can still be wrong.
NIST describes accuracy as closeness of agreement between a result and an accepted reference value.
See: NIST — Accuracy
A Note About the Word “Accuracy”
In everyday gas-sensor datasheets, manufacturers commonly use the word accuracy together with a quantitative tolerance such as:
±30 ppm ±3% of measured valueThis is normal industry usage.
Strict metrology terminology can be more nuanced. NIST notes that accuracy itself is conceptually the closeness of agreement, while quantitative performance is more rigorously described through concepts such as measurement error and uncertainty.
For practical sensor selection, the important point is:
Read the manufacturer’s stated tolerance formula carefully instead of treating the word “accuracy” as one universal number.
For example, Sensirion currently specifies the SCD53 CO₂ sensor with a range of 400–10,000 ppm and an accuracy specification of:
±30 ppm ±3% of measured valueSee: Sensirion SCD53
Resolution Is Not Accuracy
A detector can have:
Resolution: 0.1 ppmand:
Accuracy: ±5 ppmThat is possible.
Resolution tells you that the output can change in small increments.
Accuracy tells you how closely that output represents the reference concentration.
For example:
Actual concentration: 50 ppm
Displayed reading: 54.7 ppm
A display with 0.1 ppm resolution can report 54.7 ppm very precisely.
It can still be several ppm away from the reference.
LOD Is Not Accuracy Either
A low LOD means a sensor can detect very small concentrations above background under the defined test method.
It does not guarantee highly accurate quantification.
Suppose:
LOD = 0.5 ppmThis means the sensor may be capable of distinguishing a signal around that level from baseline.
But at:
50 ppmthe sensor might still have a measurement bias or calibration error.
So:
Detection and quantification are different measurement problems.
Detection vs Quantification
At very low concentration, the first question is:
Is the gas signal distinguishable from the blank?
That is the detection problem.
The next question is:
Can I report the concentration with acceptable quantitative confidence?
That is a stricter requirement.
This introduces another analytical term:
LOQ — Limit of Quantification
What Is LOQ?
LOQ stands for Limit of Quantification.
Conceptually:
LOD
Answers:
Is there enough signal to say the gas is present above background?
LOQ
Answers:
Is there enough signal to quantify the concentration with acceptable performance?
LOQ is usually higher than LOD.
Different analytical standards use different procedures for establishing LOQ, so avoid assuming one fixed formula applies to every gas sensor.
For most industrial gas-detector datasheets, LOD, range, resolution and accuracy are more commonly encountered than LOQ, but the distinction is useful when evaluating trace-gas instruments.
LOD Is Not Sensitivity
These terms are frequently used incorrectly as synonyms.
A sensor may have:
high sensitivity
because its output changes strongly with concentration.
But if the baseline is also noisy, the LOD may remain poor.
Conversely, a moderately sensitive sensor with:
- low electronic noise
- stable zero
- good compensation
may achieve excellent low-level detection.
IUPAC explicitly notes in its terminology that detection limit is often incorrectly referred to as sensitivity.
This is why the previous article, Gas Sensor Sensitivity vs Selectivity, should be read separately from LOD.
LOD Is Not Measurement Range
Another common misunderstanding is:
Range: 0–100 ppmtherefore:
minimum detectable concentration = 0 ppmThat is incorrect.
The lower printed boundary of the measurement range does not establish the detection limit.
A device can have:
Range: 0–100 ppm
LOD: 0.8 ppm
Below approximately the LOD, the output may still fluctuate around zero, but the instrument cannot reliably distinguish a small target signal from its baseline under the stated method.
The EPA Enhanced Air Sensor Guidebook also treats measurement range and detection limit as separate performance parameters.
See: EPA Enhanced Air Sensor Guidebook
A Practical Datasheet Example
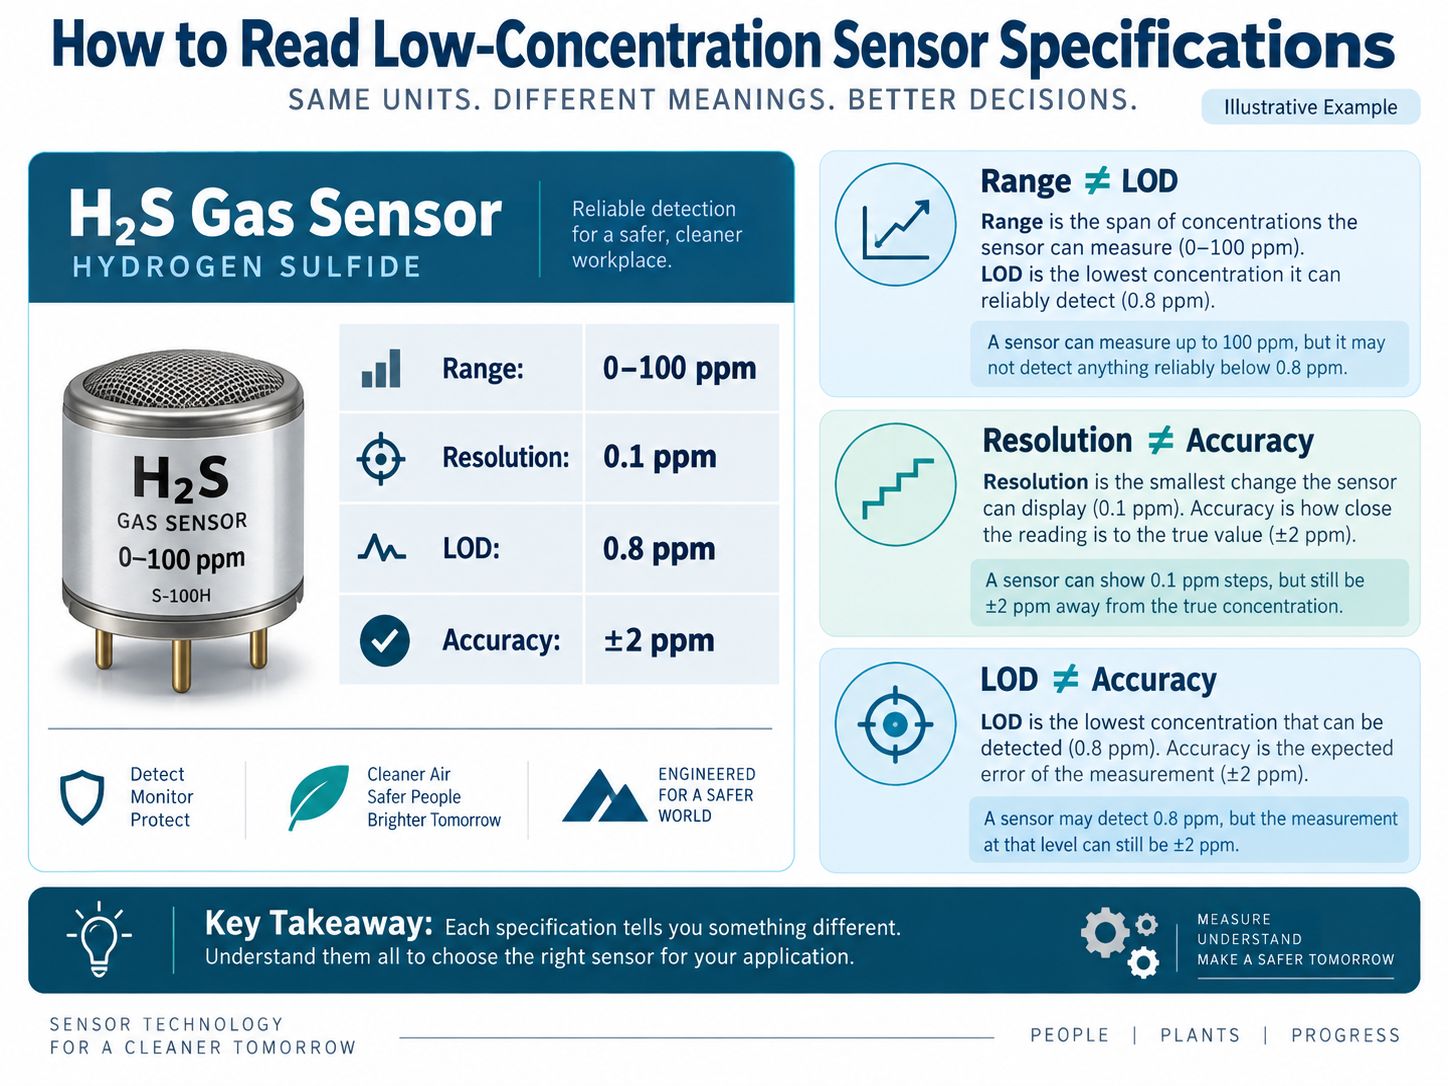
Consider this illustrative H₂S sensor specification:
Measurement Range: 0–100 ppm
Resolution: 0.1 ppm
LOD: 0.8 ppm
Accuracy: ±2 ppm
These four values answer four different questions.
Range: 0–100 ppm
The instrument is intended to measure within this concentration interval.
Resolution: 0.1 ppm
The measurement output can distinguish or report approximately 0.1 ppm increments under the defined system specification.
LOD: 0.8 ppm
Concentrations below approximately 0.8 ppm cannot be assumed to be reliably distinguishable from baseline under the stated detection method.
Accuracy: ±2 ppm
Reported values may differ from the reference by the specified tolerance under the conditions defined by the manufacturer.
This example is fictional and is used only to explain terminology.
Why “0.1 ppm Sensor” Is an Incomplete Specification
A product description may say:
0.1 ppm gas sensor
But what does 0.1 ppm mean?
It could refer to:
- display resolution
- detection limit
- alarm-setting increment
- measurement range increment
- minimum stated concentration
- repeatability
- another manufacturer-defined specification
Before selecting the sensor, ask:
What exactly does the 0.1 ppm number represent?
This is especially important in OEM sourcing, where two suppliers may advertise the same concentration number while referring to completely different performance metrics.
Baseline Stability Changes Practical LOD
A sensor may have an excellent laboratory detection limit when newly calibrated.
Months later, its baseline may drift.
Suppose the target signal is:
0.5 ppm equivalentwhile long-term baseline drift is:
±1 ppm equivalentEven if the original laboratory LOD was below 0.5 ppm, the practical field ability to separate target gas from baseline can become much worse.
This creates an important distinction:
Laboratory LOD
Measured under controlled conditions.
Practical Field Detection Capability
Affected by:
- drift
- temperature
- humidity
- contamination
- calibration history
- cross-sensitivity
For the long-term stability problem, see What Is Gas Sensor Drift? Zero Drift, Span Drift & Baseline Drift Explained.
Cross-Sensitivity Can Dominate Low-Level Measurement
Suppose a sensor is designed to detect:
Target gas: 1 ppmBut an interfering gas is present at:
100 ppmand produces an equivalent response equal to:
1 ppm target gasEven if the sensor has a laboratory LOD of:
0.1 ppmthe real mixed-gas environment may make reliable 1 ppm target detection difficult.
This means:
Analytical LOD in clean test gas is not always the same as application-level detection capability in a complex atmosphere.
For interference behavior, see Gas Sensor Cross-Sensitivity Explained.
Temperature and Humidity Matter More Near the Detection Limit
At high concentrations, a small environmental offset may represent only a minor percentage of the signal.
At trace concentrations, the same offset can be as large as the target signal itself.
Temperature and humidity can change:
- zero output
- sensitivity
- electrode kinetics
- semiconductor resistance
- optical behavior
- adsorption
- electronics
Therefore a laboratory LOD measured under controlled conditions should not automatically be treated as guaranteed performance across the full environmental operating range.
See How Temperature Affects Gas Sensor Readings and How Humidity Affects Gas Sensors.
Electrochemical Sensor LOD
Electrochemical gas sensors are widely used for low-ppm and sometimes sub-ppm toxic-gas measurement.
Their practical low-level performance can depend on:
- sensitivity
- zero current
- RMS noise
- zero drift
- temperature
- humidity
- cross-sensitivity
- amplifier design
A useful real-world example is Alphasense’s current NO₂-A1 datasheet.
It separately lists:
- sensitivity
- response time
- zero current
- RMS noise / resolution
- range
- linearity
- zero drift
- sensitivity drift
- cross-sensitivity
That structure illustrates why low-level gas performance cannot be represented by one number alone.
See: Alphasense NO₂-A1 Datasheet
Why Zero Current Matters for Electrochemical LOD
Electrochemical sensors can generate a small background current even in the absence of target gas.
That background is usually called:
zero current
If zero current is:
- large
- unstable
- temperature dependent
then distinguishing very small target-gas currents becomes more difficult.
This is why the relationship between:
zero current
and:
target-gas sensitivity
is important when designing low-level electrochemical instrumentation.
See What Is Zero Current in an Electrochemical Gas Sensor?.
MOS Sensor LOD
MOS and MOX sensors can achieve strong responses to low gas concentrations, but LOD interpretation can be more complicated because their calibration curves are often nonlinear.
Low-level performance may depend on:
- baseline resistance
- resistance noise
- heater stability
- humidity
- temperature
- sensing material
- calibration model
A simple 3σ / slope calculation assumes a reasonably defined local slope.
For strongly nonlinear response curves, LOD should be evaluated using an appropriate model and concentration region.
This is one reason you should not compare a published MOS LOD directly with an electrochemical LOD unless you understand how each value was derived.
NDIR Sensor LOD
NDIR detection limit depends strongly on optical signal-to-noise performance.
Relevant factors include:
- optical path length
- source intensity
- detector noise
- spectral filter
- reference channel
- optical contamination
- signal processing
A longer optical path can increase absorption signal.
Better signal processing can reduce effective noise.
But these choices may introduce trade-offs in:
- package size
- power
- response time
- cost
This is another reminder that complete-instrument LOD is often a system property, not just a sensing-material property.
PID Detection Limit
PID instruments detect compounds that can be ionized by the UV lamp energy.
Low-level PID performance can be influenced by:
- lamp energy
- lamp cleanliness
- electronic noise
- humidity
- target response factor
- sampling flow
- background VOCs
A PID may have excellent low-level sensitivity to one compound and substantially weaker response to another.
Therefore a generic PID detection limit should always be interpreted together with the:
calibration gas
and:
response factor
of the target compound.
Sensor LOD vs Complete Instrument LOD
A sensing element may perform extremely well on a laboratory test bench.
Once integrated into an instrument, additional components influence the result:
Sensing Element
+
Analog Front End
+
Amplifier
+
ADC
+
Temperature Compensation
+
Humidity Compensation
+
Filtering
+
Firmware
+
Calibration
The complete detector’s detection capability can therefore differ from the bare sensing element specification.
This leads to another important rule:
Do not automatically copy a bare-sensor LOD into a finished detector datasheet without validating the complete measurement system.
Signal Averaging Can Improve Low-Level Detection
Random noise can sometimes be reduced through:
- averaging
- filtering
- longer integration time
This can improve the effective signal-to-noise ratio.
But there is a trade-off.
Longer averaging can make the displayed reading respond more slowly to rapid concentration changes.
So the design problem may become:
Lower Noise
↔
Faster Response
A low-LOD environmental monitor may tolerate longer averaging.
A toxic-gas safety detector may require faster dynamic response.
For response-time fundamentals, see Gas Sensor Response Time: T50 vs T90 Explained.
Resolution, LOD and Accuracy Can Change With Conditions
Datasheet values are normally valid under defined conditions.
Performance may change with:
- temperature
- humidity
- pressure
- gas matrix
- sensor age
- calibration
- contamination
- supply conditions
A resolution number may remain digitally unchanged while practical accuracy or LOD becomes worse.
For example, an instrument may always display:
0.1 ppm incrementseven after aging increases baseline drift.
The display resolution is unchanged.
The quality of the measurement is not.
Accuracy vs Precision vs Repeatability
These terms are also frequently mixed together.
Accuracy
How close is the result to the reference value?
Precision
How closely do repeated measurements agree with one another?
Repeatability
How consistently does the measurement system reproduce results under the same defined conditions?
Consider a 100 ppm reference gas.
Sensor readings:
80
80
81
79
80 ppm
The sensor is highly consistent.
But it is far from the reference.
So it can be:
repeatable
but:
inaccurate
For the full comparison, see Gas Sensor Repeatability vs Accuracy: What’s the Difference?.
Linearity Also Affects Low-Concentration Interpretation
Suppose a sensor is calibrated at:
0 ppm
50 ppm
100 ppm
and performs linearly within that region.
That does not automatically prove that its response remains linear at:
0.1 ppmTrace measurement may require separate low-concentration validation.
Likewise, a sensor may have good low-level sensitivity but begin to compress or saturate at high concentration.
For the relationship between slope and measurement range, see Gas Sensor Linearity and Linear Range Explained.
Signal-to-Noise Ratio Is the Bridge Between Sensitivity and LOD
Signal-to-noise ratio, or SNR, is one of the most useful concepts for understanding low-level detection.
A strong target response is useful only if it stands out from the background.
Conceptually:
SNR
=
Useful signal
÷
Noise
Improving SNR can come from:
- increasing useful sensitivity
- reducing electronic noise
- improving optical design
- stabilizing temperature
- improving baseline correction
- averaging
- better shielding
- better signal processing
This topic is important enough to deserve its own terminology page:
Signal-to-Noise Ratio in Gas Sensors: Why SNR Matters.
How to Evaluate Low-Level Gas Sensor Performance
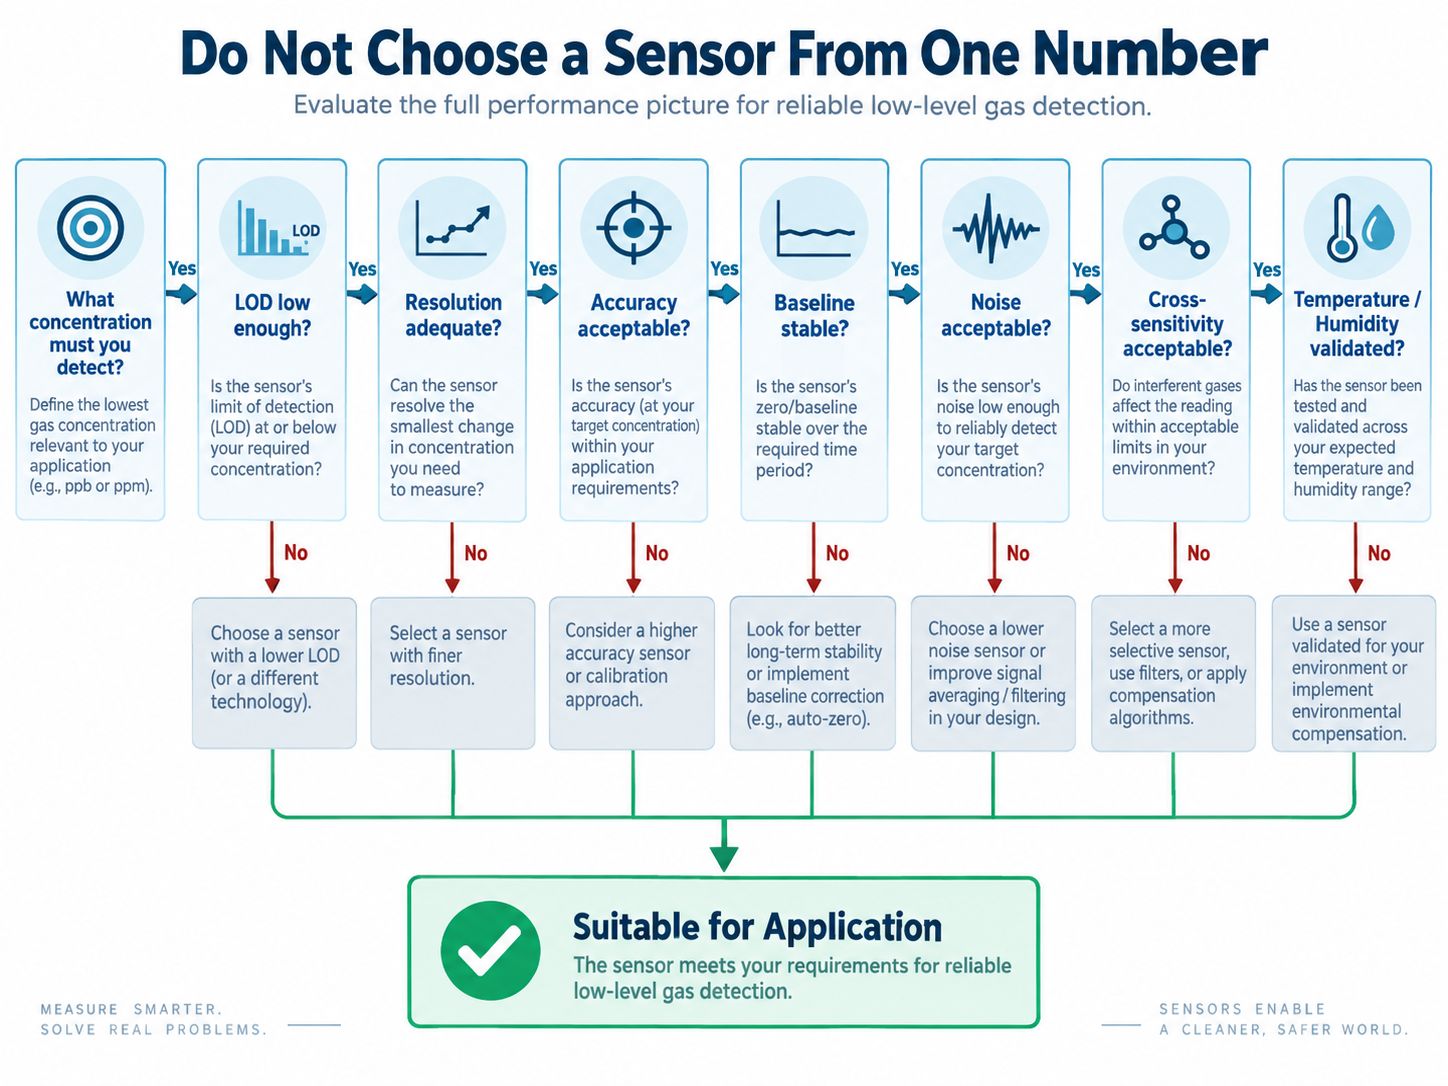
When evaluating a sensor for low-level gas measurement, do not start by asking:
Which sensor has the smallest number in the datasheet?
Use a sequence.
Step 1 — Define the Concentration You Actually Need to Detect
Is the application:
- tens of ppm?
- 1 ppm?
- hundreds of ppb?
- tens of ppb?
A lower LOD than necessary may increase cost without adding useful value.
Step 2 — Check LOD
The stated LOD should be comfortably below the concentration of interest.
Also ask how it was determined.
Step 3 — Check Resolution
Can the instrument distinguish changes small enough for your application?
Step 4 — Check Accuracy
Is measurement error acceptable at the concentration where decisions will be made?
Accuracy should be evaluated at the actual concentration of interest, not only full scale.
Step 5 — Check Baseline Stability
Look for:
- zero current
- RMS noise
- drift
- auto-zero behavior
Step 6 — Check Cross-Sensitivity
Could another gas produce a signal comparable to the target concentration?
Step 7 — Check Environmental Performance
Review:
- temperature
- humidity
- pressure
Step 8 — Check Dynamic Performance
Very aggressive filtering may improve noise but slow response.
Step 9 — Check Calibration Requirements
Low-level measurement is especially sensitive to calibration errors.
Step 10 — Validate the Complete System
Do not assume bare-sensor specifications will automatically transfer to the finished instrument.
Common LOD, Resolution and Accuracy Mistakes
Mistake 1 — Resolution = LOD
False.
A detector may display much smaller increments than it can reliably detect above background.
Mistake 2 — More Decimal Places = Better Sensor
False.
Display formatting does not prove true measurement resolution.
Mistake 3 — Low LOD = High Accuracy
False.
Detection and quantitative correctness are different performance characteristics.
Mistake 4 — High Sensitivity = Low LOD
Not necessarily.
Noise and baseline stability also matter.
Mistake 5 — Range Minimum = LOD
A stated range beginning at zero does not mean the sensor can reliably detect arbitrarily close to zero.
Mistake 6 — Ignoring Test Method
Two manufacturers may calculate LOD differently.
Mistake 7 — Ignoring Drift
A good initial LOD may deteriorate in practical field use.
Mistake 8 — Ignoring Cross-Sensitivity
Interference can overwhelm a small target-gas signal.
Mistake 9 — Using Laboratory LOD as Guaranteed Field Performance
Environmental conditions can materially change low-level performance.
Mistake 10 — Evaluating Only One Specification
Low-concentration sensing depends on the complete performance picture.
Low-Level Gas Sensor Selection Checklist
Before selecting a sensor for trace or low-ppm measurement, confirm:
- Target gas
- Required concentration range
- Required LOD
- LOD calculation or test method
- Resolution
- Accuracy / tolerance specification
- Sensitivity
- Baseline noise
- Zero current where applicable
- Drift
- Linearity
- Cross-sensitivity
- Temperature performance
- Humidity performance
- Calibration method
- Response time
- Sensor lifetime
- Complete-instrument validation
Frequently Asked Questions
What is LOD in a gas sensor?
LOD, or limit of detection, is the lowest signal or concentration that can be reliably distinguished from an appropriate blank or baseline using the stated detection method.
What is gas sensor resolution?
Resolution describes the smallest change in the measured quantity that the measurement system can meaningfully distinguish and indicate.
What is gas sensor accuracy?
Accuracy describes how closely a measured result agrees with an accepted reference value.
What is the difference between LOD and resolution?
LOD describes the lowest reliably detectable concentration.
Resolution describes how finely the measurement system can distinguish or report changes.
A sensor can therefore have:
Resolution: 0.1 ppm
LOD: 1 ppm
without contradiction.
Can a sensor have 0.01 ppm resolution but a 1 ppm detection limit?
Yes.
The display or data output may change in 0.01 ppm increments while baseline noise prevents reliable detection below approximately 1 ppm.
Does more decimal places mean better resolution?
Not necessarily.
NIST specifically warns that the number of displayed digits does not establish true instrument resolution.
Is sensitivity the same as detection limit?
No.
Sensitivity is the change in output per unit concentration.
LOD depends on the relationship between useful signal and baseline variation.
Does a higher sensitivity always improve LOD?
Higher sensitivity can help, but only if noise does not increase enough to cancel the benefit.
What determines gas sensor LOD?
Important factors include:
- sensitivity
- baseline noise
- drift
- calibration method
- environmental conditions
- interference
- signal processing
Is LOD the same as minimum measurement range?
No.
Measurement range and LOD are separate specifications.
What is the difference between LOD and accuracy?
LOD asks whether a small concentration can be distinguished from background.
Accuracy asks how close the measured result is to the reference concentration.
What is LOQ?
LOQ is the limit of quantification—the concentration above which quantitative measurement can be made with the performance required by the specified method.
Why does noise affect detection limit?
At very low concentrations, the target signal may be similar in magnitude to random baseline variation.
Lower noise makes small signals easier to distinguish.
Does averaging improve LOD?
Averaging can reduce random noise and improve effective low-level detection, but it may also slow response to changing gas concentrations.
Does temperature affect LOD?
Yes.
Temperature can change baseline, sensitivity and electronics, which can alter practical low-level detection.
Does humidity affect LOD?
Yes.
Humidity can affect electrochemical, MOS, PID and some optical systems and can therefore influence the smallest reliably detectable signal.
Does drift affect detection limit?
Yes.
A slowly changing baseline can make a small target-gas signal harder to distinguish from normal sensor movement.
Can cross-sensitivity affect practical LOD?
Yes.
An interfering gas can produce a signal larger than the target concentration you are trying to measure.
Can the same sensor have different LOD values under different conditions?
Yes.
LOD depends on test conditions and statistical method, so temperature, humidity, gas matrix, calibration and signal processing can change the result.
Final Takeaway
LOD, resolution and accuracy answer three different questions.
LOD
Can I reliably tell that this small amount of gas is present above background?
Resolution
How small a change can my measurement system meaningfully distinguish or indicate?
Accuracy
How close is my reported concentration to the accepted reference value?
Do not confuse them.
A detector can have:
fine resolution
but:
poor LOD
because the baseline is noisy.
A sensor can have:
low LOD
but:
poor accuracy
because calibration is biased.
A sensor can have:
high sensitivity
but:
poor low-level performance
because noise, drift or interference dominates the signal.
That leads to the most useful engineering rule:
Do not choose a low-concentration gas sensor from one number. Evaluate sensitivity, noise, LOD, resolution, accuracy, drift, selectivity and environmental behavior together.
That complete performance picture is what determines whether the sensor can actually solve the measurement problem.
References and Further Reading
- IUPAC — Limit of Detection
- NIST — Resolution
- NIST — Accuracy
- EPA — Enhanced Air Sensor Guidebook
- Alphasense — NO₂-A1 Datasheet
- Sensirion — SCD53 CO₂ Sensor
- GasNose — Gas Sensor Sensitivity vs Selectivity
- GasNose — Gas Sensor Drift
- GasNose — Gas Sensor Response Time: T50 vs T90
- GasNose — Gas Sensor Cross-Sensitivity
- GasNose — Gas Sensor Repeatability vs Accuracy
- GasNose — Gas Sensor Linearity and Linear Range
- GasNose — Signal-to-Noise Ratio in Gas Sensors
- GasNose — Temperature Effects on Gas Sensors
- GasNose — Humidity Effects on Gas Sensors