



Gas sensor datasheets often use terms such as:
- Sensitivity
- Linearity
- Linear Range
- Measurement Range
- Maximum Detecting Concentration
- Overload
These terms are related, but they do not mean the same thing.
A sensor may have high sensitivity but poor linearity. It may continue producing a signal beyond its linear range. It may even survive gas concentrations far above its normal measurement range without being suitable for accurate measurement there.
The most useful distinction is:
Sensitivity describes the slope of the response. Linearity describes how consistently the response follows a straight-line relationship. Linear range describes the concentration interval over which that relationship remains acceptably linear.
This matters because many gas-concentration calculations assume that a change in sensor output corresponds predictably to a change in concentration.
If that assumption is wrong, a simple one-slope conversion can produce increasingly large errors.
Linearity, Sensitivity and Range: Quick Comparison
| Parameter | Main Question |
|---|---|
| Sensitivity | How much does output change per unit change in gas concentration? |
| Linearity | How closely does the actual response follow a defined straight-line relationship? |
| Linear Range | Over what concentration interval is the response sufficiently linear? |
| Measurement Range | Over what concentration interval is the device specified for measurement? |
| Maximum / Overload Concentration | What higher exposure can the sensor tolerate or encounter under specified conditions? |
A simple way to remember them is:
Sensitivity = slope. Linearity = straightness. Linear range = where that straightness is valid.
What Is Gas Sensor Linearity?
For an ideal linear gas sensor, output can be represented approximately as:
Y = S × C + bwhere:
Y= sensor outputS= sensitivity or slopeC= gas concentrationb= zero offset
For example:
0 ppm  → 0 mV
10 ppm → 100 mV
20 ppm → 200 mV
30 ppm → 300 mV
Each 10 ppm increase produces the same 100 mV output increase.
That is an ideal linear relationship.
Real sensors rarely follow a mathematically perfect straight line at every point. In engineering use, linearity describes how closely the measured calibration curve follows the chosen linear reference within a specified range and tolerance.
NI describes sensor linearity as the extent to which the actual measured response departs from an ideal or fitted straight-line response.
What Does a Linear Gas Sensor Response Look Like?
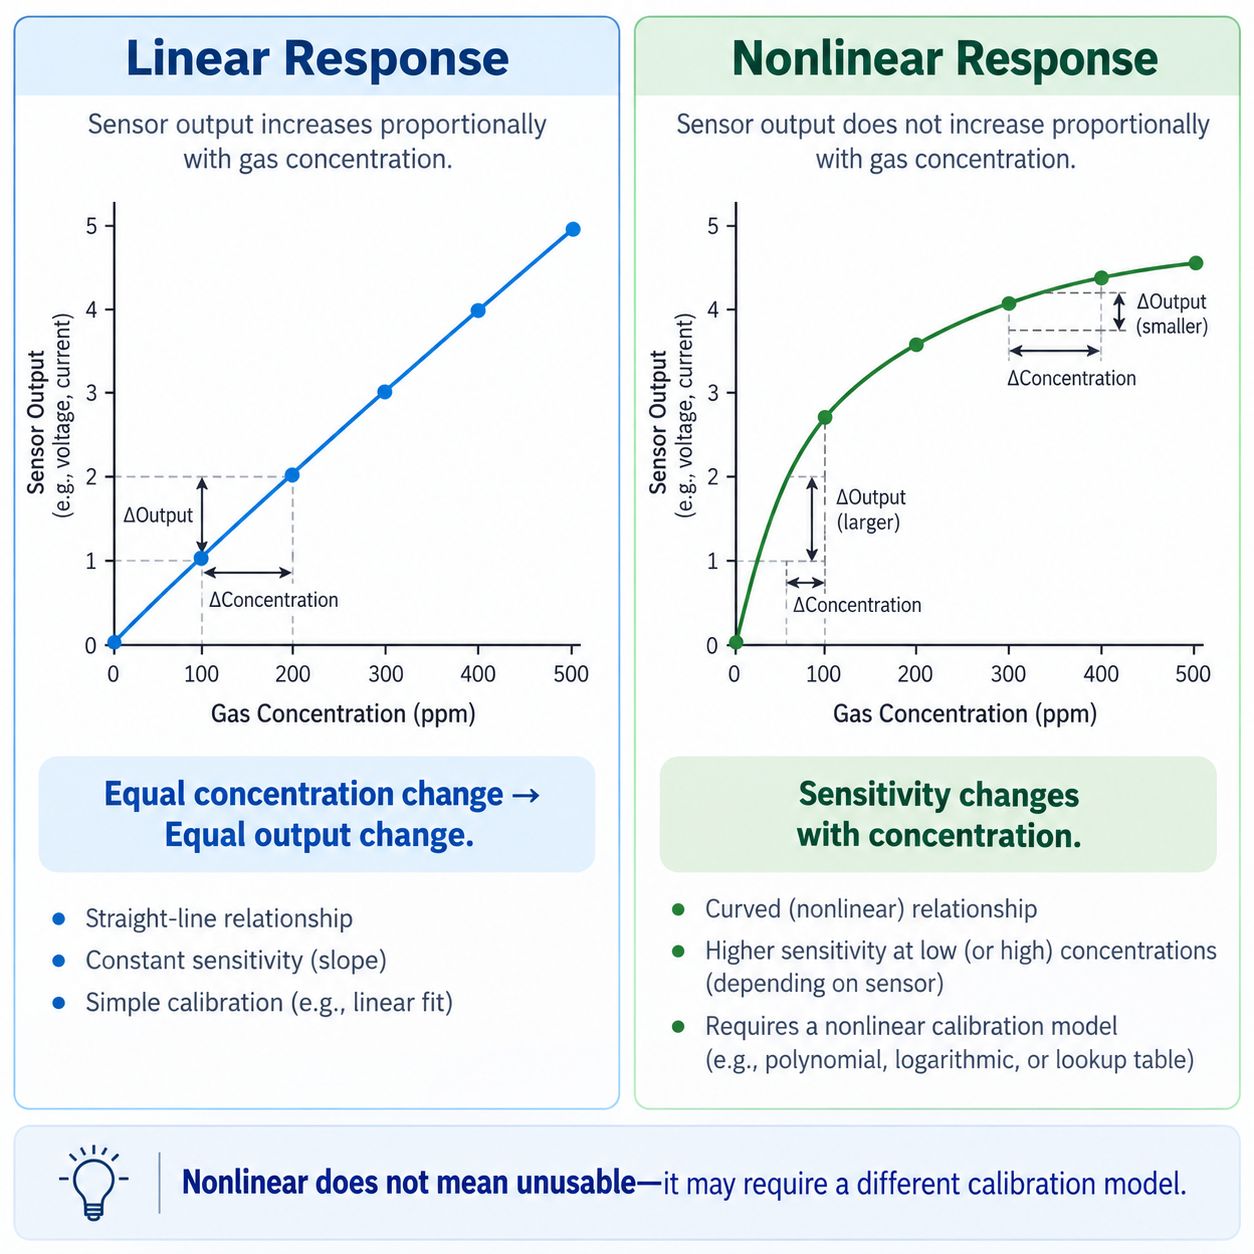
A linear sensor produces approximately equal output increments for equal concentration increments.
For example:
Gas concentration:
100 → 200 → 300 → 400 ppm
and:
Sensor output:
1 → 2 → 3 → 4 units
The slope remains approximately constant.
A nonlinear sensor may instead produce:
100 ppm → 2.5 units
200 ppm → 3.5 units
300 ppm → 4.0 units
400 ppm → 4.3 units
The sensor still responds to increasing concentration, but the amount of additional output becomes smaller at higher concentrations.
That does not automatically make the sensor unusable.
It means that a simple constant-slope conversion may no longer be sufficient.
Sensitivity vs Linearity
Sensitivity and linearity are often confused because both describe the concentration-response curve.
Sensitivity
Sensitivity is essentially the slope:
Sensitivity
=
Δ Output
÷
Δ Concentration
Linearity
Linearity describes whether that slope remains sufficiently consistent across the specified interval.
Consider two hypothetical sensors.
Sensor A
0–100 ppm:
approximately 10 nA/ppm across the range
This sensor has a relatively consistent slope.
Sensor B
0–10 ppm:
15 nA/ppm

80–100 ppm:
5 nA/ppm
Sensor B may be very sensitive at low concentration, but its slope changes considerably with concentration.
So:
A highly sensitive sensor is not automatically a highly linear sensor.
For the wider distinction between sensitivity and gas discrimination, see Gas Sensor Sensitivity vs Selectivity: What’s the Difference?.
What Is the Linear Range?
The linear range is the concentration interval over which the sensor’s concentration-output relationship remains within the manufacturer’s or measurement method’s specified linearity criterion.
Suppose the response behaves approximately linearly from:
0–100 ppmbut begins to curve above:
100 ppmThen the useful linear range may be:
0–100 ppmThis does not necessarily mean the sensor stops responding at 101 ppm.
It means the same simple linear conversion may no longer meet the specified performance requirement beyond that region.
That distinction is important.
The end of the linear range is not automatically the end of all sensor response.
Linear Range vs Measurement Range
These terms are related, but they should not be treated as universal synonyms.
Linear Range
The concentration interval over which the sensor response satisfies the defined linearity requirement.
Measurement Range
The concentration interval over which the sensor or complete instrument is specified to provide usable measurements.
Depending on the product:
- linear range may cover most or all of the measurement range
- the measurement range may extend into a region that requires nonlinear compensation
- a manufacturer may simply specify the response as “linear” throughout the stated range without publishing a separate numeric linear-range value
This is why you should read the actual datasheet rather than assume one universal relationship.
For example, current Winsen electrochemical sensor pages commonly list Measurement Range, Max Detecting Concentration, Sensitivity, Resolution, Output Linearity, and Zero Drift as separate parameters.
A chlorine sensor may be specified with a normal measurement range of 0–10 ppm and a much higher maximum detecting concentration of 100 ppm, while output linearity is listed separately.
See: Winsen ME3-CL2 Electrochemical Chlorine Sensor
Linear Range vs Maximum Detecting Concentration
This is one of the most important datasheet distinctions.
Suppose a sensor states:
Measurement Range: 0–10 ppm
Maximum Detecting Concentration: 100 ppm
It would be wrong to conclude:
The sensor accurately measures from 0 to 100 ppm.
The higher number may describe:
- maximum short-term exposure
- maximum detectable concentration
- overload capability
- a region in which response is no longer guaranteed to meet normal accuracy or linearity specifications
The exact meaning depends on the manufacturer.
For example, Winsen’s ME3-CL2 currently lists:
Measurement Range: 0–10 ppm
Max Detecting Concentration: 100 ppm
Output Linearity: linear
These are separate specifications, not one combined 0–100 ppm calibrated measurement range.
The same pattern appears across several current electrochemical sensor pages, including H₂, HF, NO₂ and O₃ models.
This leads to an important engineering rule:
Do not treat a maximum exposure or maximum detecting concentration as a normal quantitative measurement range unless the manufacturer explicitly specifies it that way.
For the broader distinction, see Gas Sensor Measurement Range vs Linear Range vs Overload.
Why Do Gas Sensors Become Nonlinear?
A concentration-response curve can become nonlinear for many different reasons.
The mechanism depends on the sensing technology.
Diffusion Limitation
In diffusion-limited sensors, gas transport through a membrane, capillary or barrier may no longer scale perfectly with external concentration.
Reaction Kinetics
Electrode or catalytic reaction behavior can change as concentration increases.
Surface Saturation
A semiconductor sensing surface may approach a state where additional gas produces progressively smaller changes.
Optical Behavior
Optical gas measurement follows an absorption relationship that may require nonlinear conversion between raw detector signal and concentration.
Oxygen Availability
Catalytic combustion sensors may behave differently when combustible concentration becomes large enough for oxygen availability or thermal balance to matter.
Electronics Saturation
The sensor element may remain responsive while the analog front end, ADC or firmware reaches its own limit.
So when a detector becomes nonlinear, the cause is not always the sensing material itself.
Electrochemical Gas Sensor Linearity
Electrochemical gas sensors often provide a useful near-linear relationship between target-gas concentration and output current over their designed range.
For a diffusion-controlled amperometric sensor, the simplified behavior is:
Gas concentration
↓
Gas flux to working electrode
↓
Electrochemical reaction
↓
Sensor current
Within the intended range:
Current ∝ ConcentrationThis is one reason electrochemical sensors are widely used for quantitative toxic-gas measurement.
Analog Devices notes that electrochemical gas sensors offer useful output linearity in addition to low power and good sensitivity.
See: Analog Devices — Overcoming the Technical Challenges of Electrochemical Gas Sensing
Current commercial product specifications reflect this as well. Winsen electrochemical CO, H₂, Cl₂, NO₂, HF and other sensor pages separately identify sensitivity, measurement range and output linearity.
However:
“Linear” on a datasheet does not mean zero measurement error at every concentration.
Sensor-to-sensor sensitivity variation, zero offset, temperature, humidity, calibration and electronics still matter.
MOS Gas Sensors Are Often Intrinsically Nonlinear
Metal-oxide semiconductor sensors frequently have a curved concentration-response relationship.
Depending on the sensing material and gas, the relationship may be represented using:
- power-law models
- logarithmic models
- empirical calibration equations
- lookup tables
A simplified MOS relationship is sometimes written in forms such as:
Rs / R0 = A × C^(-B)where:
Rs= sensor resistance in gasR0= reference resistanceC= gas concentrationA,B= empirical constants
The important point is not the exact equation.
It is that:
A nonlinear response can still be useful and repeatable when the calibration model correctly describes it.
Nonlinear does not mean inaccurate by definition.
NDIR Sensors and Linearity
NDIR sensors use infrared absorption to infer gas concentration.
The underlying optical relationship is often described through Beer-Lambert-type absorption behavior.
However, the raw detector voltage is not necessarily a straight-line function of gas concentration across the full range.
Practical NDIR systems may use:
- logarithmic conversion
- polynomial calibration
- lookup tables
- multi-point calibration
- temperature compensation
NIST notes in its calibration guidance that even when an instrument response is nonlinear, a linear calibration model may still provide accurate results if the calibration interval is sufficiently restricted.
See: NIST — Calibration
This is a useful principle for gas sensors generally:
Global nonlinearity does not prevent a sensor from having a useful local linear range.
Catalytic Combustible Gas Sensor Linearity
Catalytic-bead combustible sensors convert oxidation heat into an electrical bridge response.
Across part of the combustible-gas range, response can be treated as approximately proportional to concentration.
At higher concentrations, however, the curve may change because of:
- catalyst behavior
- thermal effects
- oxygen availability
- diffusion
- bridge characteristics
This is particularly important near or above the normal calibrated range.
A detector designed for:
0–100% LELshould not be assumed to produce a perfectly proportional signal at every combustible concentration outside its certified or specified operating range.
What Is Nonlinearity Error?
Nonlinearity error describes the deviation between the actual sensor response and a chosen linear reference.
Conceptually:
Nonlinearity Error
=
Actual Output
-
Reference Linear Output
The maximum deviation may be reported as:
- percentage of full scale
- percentage of reading
- absolute output
- concentration equivalent
NI notes that linearity is often specified in terms of percentage nonlinearity and that the calculation depends on how the reference line is defined.
Possible reference methods include:
- end-point line
- best-fit line
- least-squares fit
- manufacturer-defined reference
Therefore:
Two sensors with the same published “±2% linearity” are not automatically directly comparable unless the calculation method is also comparable.
Linearity Is Not the Same as Accuracy
A perfectly straight response can still be wrong.
Suppose the true concentrations are:
10
20
30
40 ppm
but the sensor reports:
12
24
36
48 ppm
The relationship is extremely linear.
But the slope is wrong.
After correct span calibration, this may be fixable.
The example demonstrates:
A straight calibration curve can still be inaccurate.
Accuracy also depends on:
- correct slope
- correct zero
- reference-gas accuracy
- environmental compensation
- signal processing
For the distinction between measurement correctness, resolution and detection capability, see Gas Sensor Detection Limit: LOD vs Resolution vs Accuracy.
Linearity Is Not Repeatability
A sensor may repeatedly give:
52 ppm
52 ppm
51 ppm
52 ppm
when the true concentration is:
50 ppmIts repeatability may be excellent.
Its calibration may still have an offset or slope error.
Similarly, a sensor can be linear but not repeatable if individual measurements fluctuate significantly.
For this distinction, see Gas Sensor Repeatability vs Accuracy: What’s the Difference?.
Linear Range Is Not the Same as LOD
Suppose:
Linear Range: 0–100 ppmThis does not prove that the sensor can reliably distinguish:
0.001 ppmfrom zero.
Low-concentration capability depends on:
- sensitivity
- baseline noise
- zero stability
- resolution
- LOD
- environmental effects
A sensor can be linear across a wide range but still have an LOD far above zero.
See Gas Sensor Detection Limit: LOD vs Resolution vs Accuracy.
What Happens Near Saturation?
At sufficiently high concentration, many sensor responses begin to compress.
Conceptually:
Linear response
↓
Increasing curvature
↓
Compression
↓
Saturation / plateau
Gas concentration continues increasing, but sensor output increases less and less.
If a linear conversion is still applied:
Concentration
=
Signal
÷
Sensitivity
the instrument may significantly underestimate the real gas concentration.
This can be especially important in safety systems.
A reading that appears to be:
100 ppmmay not mean the actual environment is only 100 ppm if the sensor or electronics are already saturated.
For the full topic, see Gas Sensor Saturation and Over-Range Explained.
Calibration Curve vs Linear Range
A calibration curve is the mathematical relationship used to convert sensor output into concentration.
It can be:
Linear
y = ax + bPolynomial
y = ax² + bx + cLogarithmic
Power Law
Piecewise Linear
Lookup Table
The correct model depends on sensor behavior and required accuracy.
This leads to an important principle:
A sensor does not need to be globally linear to be accurately calibrated.
It needs a calibration model that adequately represents its response over the intended measurement range.
Two-Point Calibration: When Is It Enough?
For a sensor that is sufficiently linear across the application range, a two-point calibration can establish:
- zero / intercept
- span / slope
For example:
Point 1: 0 ppm
Point 2: 50 ppm
A linear relationship is then fitted between them.
This is practical and widely used for many gas detectors.
But two-point calibration assumes that the response between and around the calibration points is adequately represented by the linear model.
If the response is strongly curved, that assumption can become inaccurate.
When Is Multi-Point Calibration Better?
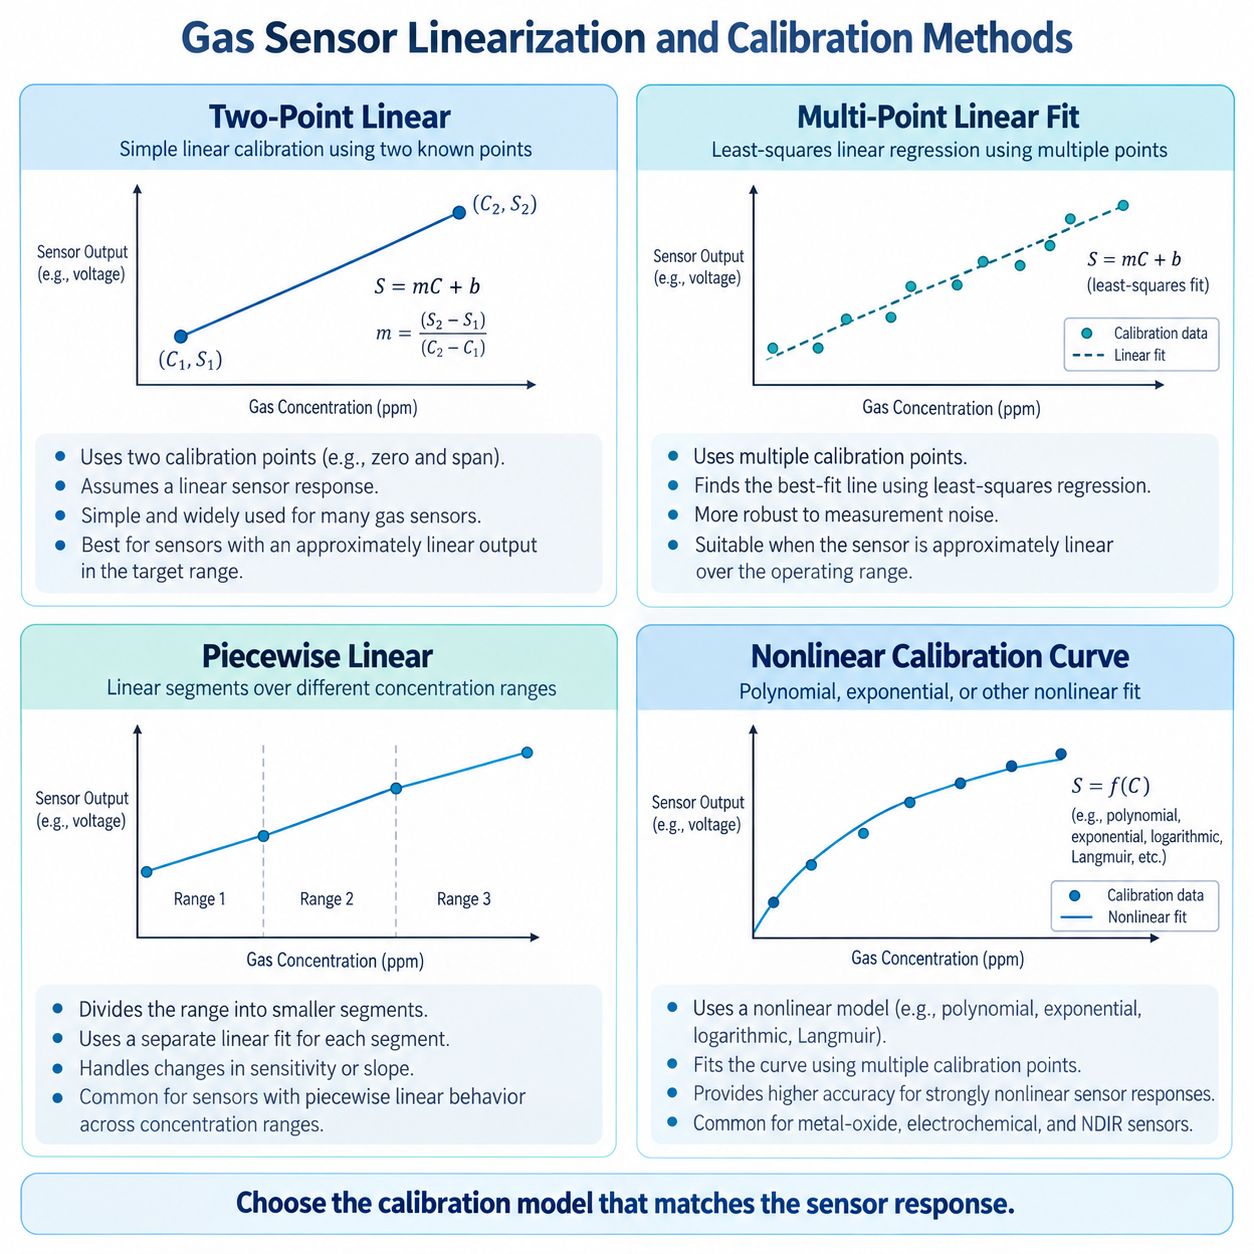
Multi-point calibration is useful when you need to:
- verify linearity
- characterize curvature
- fit a nonlinear model
- improve accuracy over a wide range
Example calibration points:
0 ppm
10 ppm
25 ppm
50 ppm
75 ppm
100 ppm
The resulting data may support:
- multi-point linear regression
- piecewise-linear conversion
- polynomial fitting
- logarithmic or power-law conversion
- lookup-table interpolation
The best approach depends on:
- sensor principle
- measurement range
- required accuracy
- computational resources
NIST’s calibration guidance likewise emphasizes that the calibration model should match the actual instrument response.
Two-Point Calibration vs Multi-Point Linearity Testing
These are related but not identical tasks.
Two-Point Calibration
Used to adjust:
- offset
- slope
Multi-Point Linearity Testing
Used to determine whether intermediate concentrations follow the assumed calibration relationship.
A detector can pass zero and span calibration while still having significant nonlinearity between those points.
For example:
0 ppm → correct
100 ppm → correct
50 ppm → reads 60 ppm
The two endpoints are correct.
The middle of the curve is not.
This is why multi-point testing is valuable when linearity itself matters.
Why R² Does Not Tell the Whole Story
Linear regression often produces an R² value.
A result such as:
R² = 0.999looks impressive.
But R² alone does not prove that every concentration point meets the application’s allowable error.
Over a wide measurement range, a model can have a very high R² while still showing unacceptable deviation at one important low-concentration region.
Therefore also examine:
- residuals
- maximum deviation
- low-concentration error
- full-scale error
- application-specific tolerances
High R² supports a good overall fit; it is not a substitute for checking actual measurement error.
Temperature Can Change Linearity
A calibration curve characterized at:
25°Cmay not remain identical at:
-20°Cor:
50°CTemperature can affect:
- sensitivity
- zero current
- diffusion
- reaction kinetics
- MOS surface chemistry
- optical sources and detectors
- analog electronics
NI specifically notes that static nonlinearity can be influenced by environmental factors such as temperature and humidity.
For gas-specific effects, see How Temperature Affects Gas Sensor Readings.
Humidity Can Change the Calibration Relationship
Humidity can affect:
- electrochemical electrolyte behavior
- MOS surface adsorption
- VOC response
- optical measurement conditions
The effect may not be identical at every gas concentration.
As a result, a calibration curve obtained at:
50% RHmay not perfectly represent the sensor at:
90% RHFor the broader topic, see How Humidity Affects Gas Sensors.
Drift Can Change the Calibration Curve
Gas sensor drift can alter either the intercept or the slope.
Zero Drift
The baseline moves.
In a simple linear model:
Y = S × C + bthe b term changes.
Span Drift
Sensitivity changes.
The S term changes.
This means that even a sensor with excellent initial linearity can become inaccurate if its zero or sensitivity changes over time.
See What Is Gas Sensor Drift? Zero Drift, Span Drift & Baseline Drift Explained.
How to Validate Gas Sensor Linearity
A practical linearity test can follow this workflow.
Step 1 — Define the Required Range
Choose the actual concentration interval that matters for the application.
Step 2 — Select Multiple Reference Concentrations
Use certified or appropriately traceable gas standards.
For example:
0%
20%
40%
60%
80%
100% of the intended range
Step 3 — Stabilize the Sensor
Control:
- warm-up
- bias
- temperature
- humidity
- flow
according to the sensor or instrument specification.
Step 4 — Apply Each Concentration
Record the stabilized output under comparable conditions.
Step 5 — Plot Concentration vs Output
Create the calibration curve.
Step 6 — Fit the Intended Model
For example:
- linear regression
- piecewise fit
- nonlinear model
Step 7 — Examine Residuals
At each point calculate how far the actual response differs from the model.
Step 8 — Compare With the Required Tolerance
The relevant tolerance may be defined in:
- ppm
- % reading
- % full scale
- voltage/current units
Step 9 — Verify With Independent Points
If the measurement is critical, validate the model using concentrations not used to construct the fit.
The goal is not to produce the prettiest graph.
It is to determine whether the calibration model is accurate enough for the real measurement problem.
How to Read Gas Sensor Linearity in a Datasheet
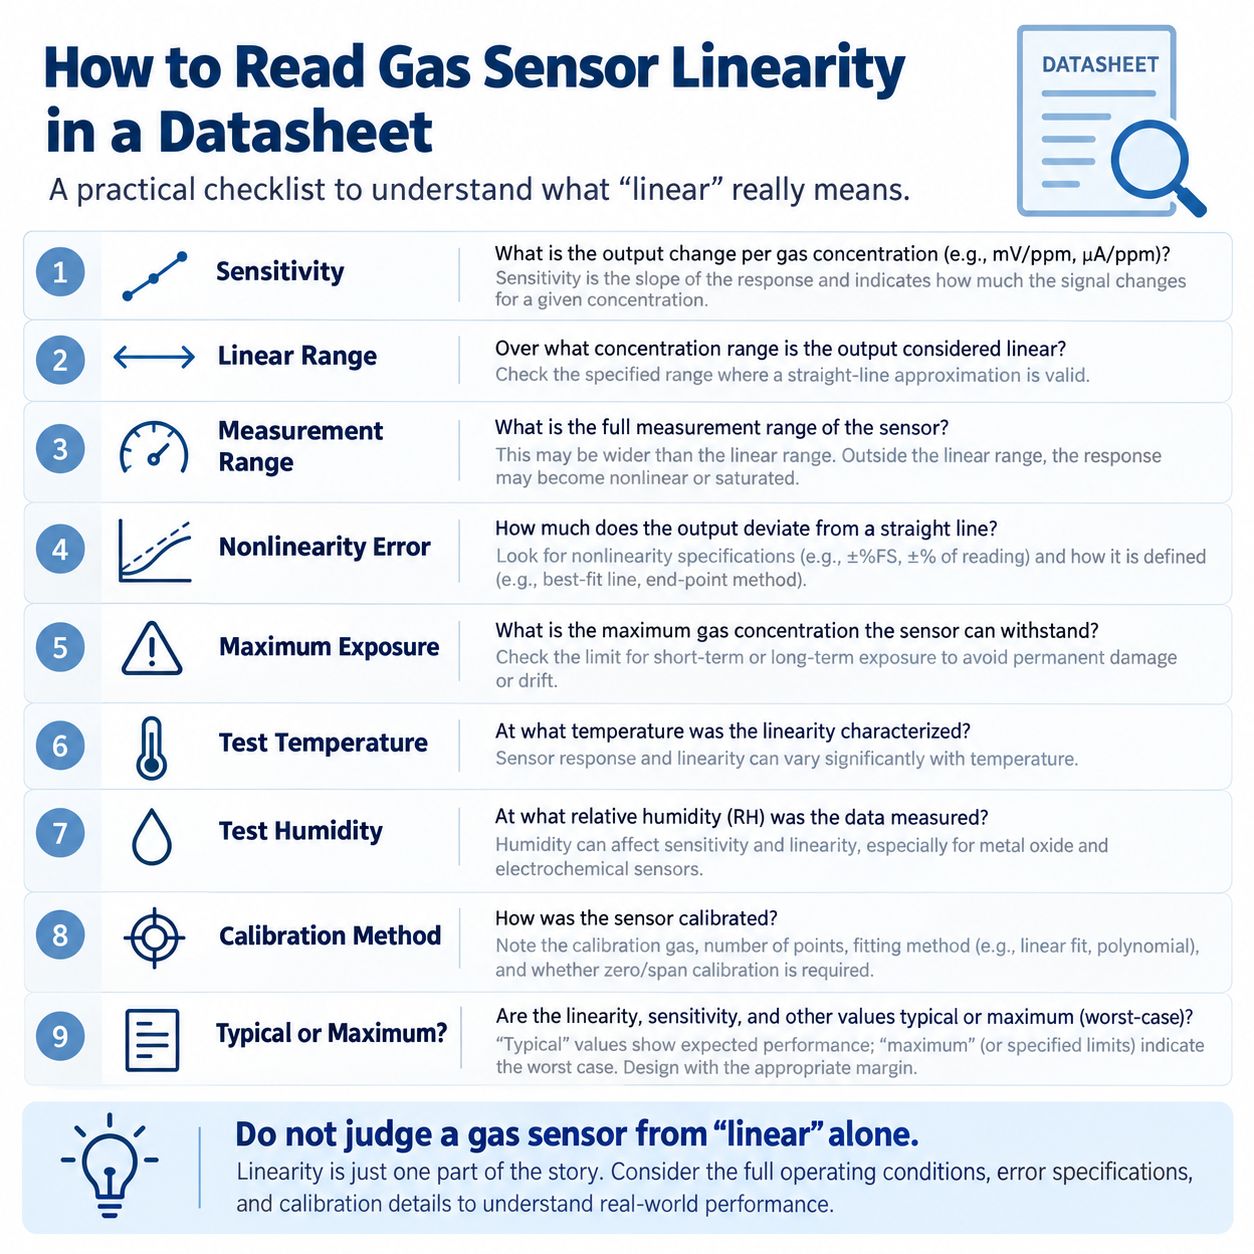
When a datasheet says:
Output Linearity: Lineardo not stop reading.
Check the following.
1. Sensitivity
What output change is expected per unit concentration?
2. Measurement Range
Over what concentration interval is the sensor intended to measure?
3. Linear Range
Is a separate linear range specified?
4. Linearity / Nonlinearity Tolerance
Is there a numeric specification such as:
±2% FSor another error limit?
5. Reference Method
Is nonlinearity measured relative to:
- end-point line
- best-fit line
- another manufacturer-defined line?
6. Maximum Detecting / Exposure Concentration
Do not confuse this with calibrated range.
7. Temperature
At what temperature was the response characterized?
8. Humidity
At what RH were the values measured?
9. Calibration Method
Was the sensor characterized with:
- one span point
- several concentrations
- nonlinear compensation?
10. Typical vs Guaranteed Values
A typical response curve is not the same as a guaranteed maximum specification.
A Practical Datasheet Example
Consider this illustrative example:
Measurement Range: 0–100 ppm
Linear Range: 0–80 ppm
Sensitivity: 10 nA/ppm
Nonlinearity: ±2% FS
Maximum Exposure: 500 ppm
0–80 ppm
The simple linear conversion is specified to remain within the stated linearity criterion.
80–100 ppm
The sensor may still provide a usable measurement, but the manufacturer may specify different error behavior or nonlinear correction.
100–500 ppm
This should not automatically be treated as a quantitative measurement region.
The sensor may simply be able to tolerate or respond to the exposure without immediately failing.
This example is intentionally generic.
Always use the definitions in the specific sensor datasheet.
Linearity and Response Time Are Different
A sensor can be:
- very linear
- but slow
or:
- less linear
- but fast
Linearity describes a static concentration-output relationship.
Response time describes how quickly the sensor reaches that relationship after concentration changes.
Do not use one as a substitute for the other.
For T50 and T90, see Gas Sensor Response Time: T50 vs T90 Explained.
Linearity and Hysteresis Are Different
A sensor may follow one curve when concentration increases and another when concentration decreases.
This is hysteresis.
Even if each direction looks approximately linear, the two curves may not overlap.
That creates another source of measurement error that cannot be fully described by a single linearity number.
See Gas Sensor Hysteresis Explained.
Common Gas Sensor Linearity Mistakes
Mistake 1 — Sensitivity = Linearity
False.
Sensitivity is slope. Linearity describes deviation from a straight-line relationship.
Mistake 2 — Measurement Range = Linear Range
Not necessarily.
Read the manufacturer definitions.
Mistake 3 — Maximum Exposure = Measurement Range
False.
A sensor may survive or respond beyond its calibrated measurement range without providing accurate concentration data there.
Mistake 4 — Linear = Perfectly Accurate
False.
A straight response can still have the wrong slope or offset.
Mistake 5 — High R² = Every Point Is Accurate
False.
Check residuals and application-specific error.
Mistake 6 — Two-Point Calibration Proves Linearity
False.
Two points define a line; they do not prove that intermediate points follow it.
Mistake 7 — Nonlinear = Bad Sensor
False.
A well-characterized nonlinear sensor can be highly useful with an appropriate calibration model.
Mistake 8 — Ignoring Saturation
A linear conversion can severely underestimate gas concentration once the response begins to compress.
Mistake 9 — Ignoring Temperature and Humidity
Environmental conditions can change both slope and curve shape.
Mistake 10 — Comparing Linearity Numbers Without Checking the Method
Different reference-line definitions can produce different reported nonlinearity values.
Gas Sensor Linearity Selection Checklist
Before choosing a sensor based on linearity, confirm:
- Target gas
- Required measurement range
- Sensitivity
- Linear range
- Measurement range
- Maximum detecting / overload concentration
- Linearity error specification
- Reference-line method
- Calibration model
- Number of calibration points
- Temperature conditions
- Humidity conditions
- Drift
- Saturation behavior
- Sensor vs complete-module specification
- Required accuracy in the actual application
Frequently Asked Questions
What is gas sensor linearity?
Gas sensor linearity describes how closely the sensor’s output follows a specified straight-line relationship with gas concentration over a defined range.
What is the linear range of a gas sensor?
The linear range is the concentration interval over which the concentration-output relationship remains within the defined linearity requirement.
What is the difference between sensitivity and linearity?
Sensitivity describes the slope of the response.
Linearity describes how consistently the response follows a straight-line relationship.
Can a sensor be highly sensitive but nonlinear?
Yes.
A sensor may produce a large signal at low concentration while its slope changes significantly as concentration increases.
What is the difference between linear range and measurement range?
Linear range describes where the response meets a linearity criterion.
Measurement range describes where the sensor or instrument is specified to provide usable measurements.
They may be identical for some products and different for others.
Is maximum detecting concentration the same as measurement range?
No.
A maximum detecting or overload concentration may describe a higher exposure level that is outside the normal quantitative measurement range.
Is a nonlinear gas sensor inaccurate?
Not necessarily.
A nonlinear sensor can provide accurate concentration measurements if the calibration model correctly represents its response.
What causes gas sensor nonlinearity?
Possible causes include:
- surface saturation
- diffusion limitation
- reaction kinetics
- optical behavior
- oxygen availability
- electronics saturation
What is nonlinearity error?
Nonlinearity error is the deviation between the actual sensor response and the selected linear reference curve.
How is gas sensor linearity tested?
Expose the sensor to several known concentrations across the intended range, record output, fit the intended calibration model and evaluate deviations from that model.
Is R² a measure of sensor linearity?
R² can indicate how well a regression model explains the overall data, but it does not by itself establish acceptable linearity error at every point.
What happens outside the linear range?
The sensor may continue responding, but the same simple linear conversion may no longer produce the required accuracy.
Does saturation cause nonlinearity?
Yes.
As the sensor approaches saturation, concentration can continue increasing while output changes progressively less.
Can temperature affect linearity?
Yes.
Temperature can change sensitivity, reaction kinetics, diffusion, semiconductor behavior and electronics.
Can humidity affect linearity?
Yes.
The effect depends on sensor technology and target gas.
Is two-point calibration enough?
It can be sufficient when sensor response is reliably linear over the required range.
Two-point calibration alone does not prove linearity.
When should multi-point calibration be used?
Multi-point calibration is useful when:
- the range is wide
- the response is nonlinear
- high accuracy is required
- linearity must be verified
Final Takeaway
Gas sensor linearity is not simply another word for sensitivity.
Remember:
Sensitivity
=
how steep the response curve is
Linearity
=
how closely the response follows the chosen straight-line modelLinear Range
=
where that linear relationship remains acceptably validMeasurement Range
=
where the sensor or instrument is specified for measurementMaximum / Overload Range
=
a higher exposure region that should not automatically be treated as a normal quantitative measurement rangeA highly sensitive sensor can be nonlinear.
A highly linear sensor can still be inaccurately calibrated.
A nonlinear sensor can still be accurate when the correct calibration model is used.
And a sensor that survives a high gas concentration does not necessarily measure that concentration accurately.
That leads to the most useful engineering rule:
Do not choose a gas sensor because the datasheet simply says “linear.” Check the range, linearity tolerance, sensitivity, calibration method, environmental conditions and behavior near saturation.
References and Further Reading
- NI — Sensor Terminology
- NIST — Calibration
- Analog Devices — Overcoming the Technical Challenges of Electrochemical Gas Sensing
- Winsen — ME3-CL2 Electrochemical Chlorine Sensor
- Winsen — ME3-H2 Electrochemical Hydrogen Sensor
- Winsen — ME3-HF Electrochemical HF Sensor
- Winsen — ME3-NO2 Electrochemical Nitrogen Dioxide Sensor
- GasNose — Gas Sensor Sensitivity vs Selectivity
- GasNose — Gas Sensor LOD vs Resolution vs Accuracy
- GasNose — Gas Sensor Drift
- GasNose — Gas Sensor Response Time: T50 vs T90
- GasNose — Gas Sensor Repeatability vs Accuracy
- GasNose — Gas Sensor Measurement Range vs Linear Range vs Overload
- GasNose — Gas Sensor Saturation and Over-Range
- GasNose — Gas Sensor Hysteresis
- GasNose — Temperature Effects on Gas Sensors
- GasNose — Humidity Effects on Gas Sensors